Executive Summary
| Shrink by Category | Emerging Trends | Shrink by Department | Shrink Fast Facts | Summary |
The Winds of Change
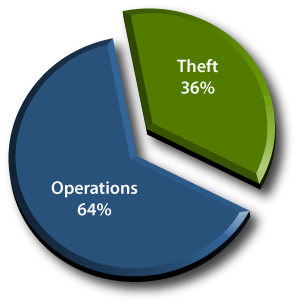 Research by FMI and The Retail Control Group into the causes and cures of retail supermarket shrink indicates that 64% of store shrink is directly caused by a breakdown in, or the absence of, effective store operating best practices, while 36% of store shrink is cause by theft and/or misdeeds.
With the evolving recognition of this condition, 47% of companies report a growing shift in the roll of loss / asset protection departments to expanded focus on operation-centric profit protection and realization, and a more collaborative partnership with store operations.
Fifty-four percent of responding companies said they do not have formal LP training for district managers, store managers, cashiers and/or employees. When loss prevention and shrink control budgets are examined, evidence suggests a disproportionate allocation of budget dollars when comparing company investments in technologies to catch theft versus budget dollars allocated to training of store personnel in effective store operating practices known to prevent shrink loss.

Survey respondents reported overall store shrink at 2.70% of retail sales, with the low average of 1.76% of retail sales and the high average of 3.10% of retail sales.
| Return to Top |
Three Emerging Trends
Technology
Certain technologies have become ubiquitous in stores today. Over 82% have automated DSD, POS monitoring and CCTV, yet shrink loss remains at 2.70% of retail sales. Emerging Technologies include store task management, advanced data mining systems and business intelligence analytics. Companies further report plans to slow technology investments in coming years.
Integration and Collaboration
Companies that report lower than average shrink utilize cross-functional training of loss prevention, audit and store operations personnel to implement coordinated profit improvement through traditional loss prevention combined with operational best practices. Throughout this survey evidence persists that consistent and on-going store manager and store team operational best practices and loss prevention training is the number-one factor in controlling store shrink. Operational controls and processes form the foundation for all sales and profit optimization efforts.
Control Conditions
Extensive cross-tabbing and cause-and-effect correlation analysis revealed when certain operational conditions are present, they had an effect of systemically and significantly restraining shrink loss. Most evident among these control conditions are six influencers:
- Formal Known Loss Control
- Strict Ordering Controls
- Inventory Management and Turnover controls
- Connected Store Manager with Clear Standards of Operation
- Organizational Best Practices
- Measurable Accountability
When teams are trained and held accountable to execute these six control conditions, the effect is a systemic reduction in store shrink up to 15%.
| Return to Top |
Shrink by Category
Shrink from operations and shrink from theft can be detailed by category, as shown in the table below:

CATEGORY |
SHRINK CONTRIBUTION |
| Ordering Inefficiencies | 14% |
| Production Planning | 11% |
| Product Handling Errors | 9% |
| Employee / Cashier Errors | 9% |
| Rotation Errors | 8% |
| Receiving Errors | 4% |
| Damaged / Unsalable Goods | 4% |
| Scan File Errors | 3% |
| Accounting Errors | 2% |
| OPERATIONS | 64% |
| Shoplifting | 13% |
| Cashier Theft | 11% |
| General Employee Theft | 9% |
| Vendor Theft | 3% |
| THEFT | 36% |
| Return to Top |
Shrink by Department
Survey respondents reported overall store shrink at 2.70% of retail sales, with a low average of 1.76% of retail sales and a high average of 3.10% of retail sales. The following table provides details for sales and shrink by department.
DEPARTMENT |
SHRINK CONTRIBUTION |
SHRINK |
DEPARTMENT SHRINK |
PERCENTAGE OF SALES |
AVERAGE ANNUAL SALES |
Meat |
18% | $93,414 | 4.1% | 12% | $2,278,390 |
Produce |
16% | $82,022 | 4.8% | 9% | $1,708,792 |
Deli |
14% | $74,048 | 7.8% | 5% | $949,329 |
Bakery |
6% | $30,379 | 8.0% | 2% | $379,732 |
Seafood |
5% | $23,543 | 6.2% | 2% | $379,732 |
Dairy |
4% | $19,936 | 1.5% | 7% | $1,329,061 |
Floral |
2% | $9,683 | 5.1% | 1% | $189,866 |
PERISHABLES |
4.62% |
65% |
$333,025 |
38% |
$7,214,901 |
Grocery |
14% | $71,010 | 1.1% | 34% | $6,455,438 |
GM |
8% | $41,011 | 2.7% | 8% | $1,518,926 |
RX |
5% | $25,062 | 2.2% | 6% | $1,139,195 |
HBA |
3% | $14,240 | 2.5% | 3% | $569,597 |
Frozen |
2% | $7,595 | 0.8% | 5% | $949,329 |
Beer/Wine/Liquor |
2% | $9,493 | 1.0% | 5% | $949,329 |
Video |
1% | $3,892 | 4.1% | 1% | $94,933 |
NON-PERISHABLES |
1.48% |
35% |
$172,303 |
62% |
$11,676,747 |
|---|---|---|---|---|---|
TOTAL |
100% |
$512,922 |
2.70% |
100% |
$18,986,581 |
| Return to Top |
Shrink Fast Facts
- Companies report 66% of stores are of conventional supermarket format and 34% of their stores followed the super-store format.
- 43% of survey respondents reporting using the cost accounting method while 57% reported using the retail method of accounting.
- 29% of respondents reported that stores can positively affect their reported shrink loss in five primary ways: Forward buying (most common), execute prices early, deal buy, break open quantity packs for inflated price single-item sales and writing off product for credit all practices that serve to mask actual shrink loss.
- 80% of respondents expect shoplifting will increase in the next 1 - 2 years.
- 74% of respondents have self-checkout lanes in super store format stores with an average of 4.43 self-checkout lanes per store. 58% of respondents have self-checkout lanes in conventional format stores with an average of 3.25 self-checkout lanes per store.
- Stores reported average net cash shortages of -$6.00 in conventional store format and -$21.15 in super store format.
| Return to Top |
Summary
Significant in the survey findings for 2012 were four primary points:
- Sixty-four percent of all shrink was caused by the breakdown of operational practices at the store exposing significant new focus on operational practices to prevent shrink and disrupt shrink-causing conditions.
- There is an expanded focus of loss prevention into a more collaborative partnership with store operations.
- Certain core technologies are now present in most companies, but shrink remains essentially flat at 2.70%.
- Continual training of employees on the operational best practices to reduce and control store shrink has the most significant impact potential.
| Return to Top |
For additional questions regarding shrink research, operational best practices, or higher profit, email us at info@wheresmyshrink.com.